SEO Analytics and Reporting: Tips, Best Practices and Tools to Get Started
Optimizing your SEO analytics reporting doesn’t have to be hard. Find out how you can streamline the whole process with the right tools, tips, and tricks.
Davor Štefanović on November 25, 2021 (last modified on March 22, 2023) • 19 minute read
Everyone who’s been in the SEO industry knows how frustrating metrics fluctuations can be — especially considering the time it takes for you to see any results.
You’re working on your project diligently, building backlinks, optimizing on-site content, tweaking keywords and entities, and everything else you need to do to run a successful SEO campaign, but still, despite all your efforts, the metrics may shift unfavorably.
How are you going to explain this to your clients? If your clients aren’t well versed in the industry processes, they may get worried.
Now, the fluctuations you might see can be caused by any number of factors, from Google algorithm updates to changes in overall search trends for other reasons such as world events and seasonal shifts. No matter the factor, you still need to know what caused the change, be able to analyze how it will affect the website, and make decisions about the future of the campaign based on that information.
And that’s exactly where a good SEO reporting tool comes in. An SEO Analytics tool will not only help you monitor changes and spot issues in a timely manner, but also give you the ability to present this information to your clients in an easy-to-understand way and reassure them that you are on the right path.
Want to learn more? Let’s take a closer look at how SEO analytics reporting works.
- What Is SEO Analytics?
- What Makes SEO Reporting and Analytics so Important?
- How to Set Up and Make the Most of Your SEO Analytics
- SEO Analytics Best Practices
- How to Simplify SEO Analytics Reporting with Databox

What Is SEO Analytics?
Put simply, SEO analytics is the process of collecting, collating, and analyzing data related to directing organic traffic to your client’s website. You’re trying to figure out what is working and why and what obstacles you need to overcome to successfully drive traffic and conversions for your clients. Thanks to modern tools, every piece of data can be tracked easily. That means that you can easily present all the information to the client in a way that makes sense.
SEO analytics can help you spot issues in a timely manner and identify new opportunities to optimize your website. For example, you can identify new keyword opportunities or your top-converting traffic sources. Issues-wise, you may observe that certain pages have a high bounce rate, and by digging into the problem further, identify that the negative user experience is actually caused by slow loading pages on your site.
An SEO reporting tool generally makes data analysis easier and can quickly perform tasks like rank tracking, data visualization, analytics and reporting. This allows you to spend significantly less time inside of a spreadsheet crunching numbers and frees you up to think about the marketing strategy. So, it’s no wonder SEO tools are the most frequently used when it comes to monitoring and reporting on performance, as confirmed by Databox State or Reporting research.
What Makes SEO Reporting and Analytics so Important?
Doing detailed SEO analytics and building comprehensive reports gives you a better insight into what your client’s customers want and what kind of messaging they respond to. A comprehensive SEO report built with quality data can clearly show which types of content and topics drive user engagement, thus leading to increased conversions.
The insight into customer preferences will allow you to focus the marketing strategy with precision. After all, no matter your budget, your resources will be limited in some way, and it’s important to optimize your plan to get the best results. This allows you to direct time and effort into creating content that is much more likely to engage the target demographic and improve ROI.
Using data gained from SEO analytics tools allows you to build actionable SEO reports that can make it easier to respond to rising trends and consumer needs. Some purchasing trends are seasonal, and the marketing campaign needs to be oriented in such a way to make the best use of it.
PRO TIP: How to Analyze Your Best Pages for SEO Performance
To optimize your website for organic search, you probably use Google Search Console to learn which pages receive the most impressions and clicks, and which queries are driving them. Now you can quickly assess your SEO performance in a single dashboard that monitors fundamental metrics, including:
- Which search queries drive traffic to my website?
- Which of my website pages generate the most impressions and clicks in search engines?
- What’s the average click-through rate (CTR) for our website pages in search?
- What’s the average position our website pages show up in search results?
- How many clicks have our website pages generated in search results this month?
Now you can benefit from the experience of our Google Search Console experts, who have put together a great Databox template showing the most important KPIs for monitoring organic search performance. It’s simple to implement and start using as a standalone dashboard or in marketing reports, and best of all, it’s free!

You can easily set it up in just a few clicks – no coding required.
To set up this Google Search Console Dashboard, follow these 3 simple steps:
Step 1: Get the template
Step 2: Connect your Google Search Console account with Databox.
Step 3: Watch your dashboard populate in seconds.
How to Set Up and Make the Most of Your SEO Analytics: 4 Key Steps
Analytics can help you ground decisions in good data and reduce the threat of bias. With effective SEO analytics and reporting process, you’ll be able not only to identify the important information but also to act on it and capitalize on potential opportunities.
Here are the most important steps to making the most of your SEO analytics:
- Preparing and Enabling a Strong Start
- Setting up the Right Analytics Tools
- SEO Analysis via Data visualization
- Decision making and Acting on Insights
Preparing and Enabling a Strong Start
There are four things you need to pay attention to in order to ensure a good start for your SEO analytics and reporting.
Type of client
First, you need to consider your client. Not all clients will be willing to dedicate a significant portion of their marketing budgets to analytics as opposed to execution. However, they may not need to, or convincing them might simply take too much effort.
What you can do is look for clients who are likely to make data-driven decisions. These are usually marketing agencies, marketing teams with a good online presence, executives with backgrounds in finance or other industries where it’s imperative to act on data, and e-commerce specialists.
These people have a high appreciation for data, long-term focus, advanced marketing knowledge, and a capacity and willingness to act on ideas.
Team roles
Second, consider team roles and skills. SEO analytics reporting can be done by a single person or a full team that’s assisted with cutting-edge software. Either way, you need to understand the roles and responsibilities involved in the process. The team needs to be able to collect data from various sources, perform data visualizations, analyze data and provide insights, and prepare data for the client in an actionable report.
Depending on the project size and complexity, you may do the project by yourself or need a whole team, including a project director, SEO analysts, technical SEO experts, link builders, illustrators, technical SEO experts and content managers. For smaller projects, one person can cover multiple roles. When it comes to larger ones, you may need multiple people for one role.
Budget
Third, you need to take a look at the resources you have available. More specifically, the budget. Since Analytics are both time-intensive and require a specialized skillset, you may need to spend quite a lot of money just for your team’s salaries, let alone specialized tools and additional resources.
You can expect to spend in excess of $3,000 per month if you want to leverage the data well. Any less, and you’re unlikely to create effective data analysis processes and feedback loops.
SEO analytics frequency
This is another factor to consider in the very beginning. The frequency you’re going to perform SEO analytics will, of course, depend on the budget, but it makes sense to review the numbers at least once a week.
However, if you choose to go with a reporting tool, you can track the required metrics in real time and have the information sent to you, your team, or the client as frequently as you want. That will ensure everyone is always up-to-date with important data.
Setting Up the Right Analytics Tools
Now that we’ve covered the basic setup, we can move on to the tools you’ll need to collect data.
- Google Analytics
- Google Search Console
- Google Tag Manager
- Google Ads
- Google My Business
- Databox
Google Analytics
While there are many analytics tools available, Google is the biggest search engine by far so it only makes sense to pick Google Analytics as the primary one.
Google Analytics tells you what actions visitors perform after they land on a page of your website. The reported metrics include the number of visited pages, the last visited page, and many others.
Since Google’s tools integrate very well, you can link GA with other tools allowing you to gather more actionable data.
In order to set up Google Analytics:
- You need to create or sign into your Analytics account by going to google.com/analytics.
- Set up a property in your account — this is a website or an app, and it’s the focus of Analytics’ collection process.
- You should set up a reporting view in your property — it allows you to create filtered perspectives of your data by region, IP address, or some other factor.
- Add the tracking code to your website so that it can collect data. You can find it by navigating to your property and clicking on Tracking Info > Tracking Code.
- Finally, you can set up “Goals” in Analytics. They’re an excellent way to track important events and measure the effectiveness of your campaign.
Google Search Console
Unlike Google Analytics, Google Search Console tells you what happened before a user visited your site or an app. It’s a tool that helps you measure your site’s Search traffic and performance, fix issues, and make your site more appealing to Google’s search engine.
Search Console covers analyzing impressions, clicks, and Google SERP; identifying search queries that bring visitors to your site, testing mobile usability, etc.
When you integrate it with Google Analytics, you get a comprehensive picture of a user’s activity both before and after their visit to your website, allowing you to optimize the future customer journey.
To set up Google Search Console:
- Log in with the same account you used for GA at search.google.com.
- Click on Add a property and choose between a Domain or a URL prefix.
- Verify domain ownership.
Google Tag Manager
This is an excellent tracking and tagging platform that also allows you to add code for on-page optimization.
You can use it to implement a schema markup for particular post types, thus helping search engines to understand your content better. In addition, you’ll be able to record all interaction events in GA in which a visitor spends more than a specified amount of time on the website (30–45 seconds is a good cutoff). If a user spends more than 45 seconds on your website, it’s likely not a simple bounce and shouldn’t be counted as such. They probably found the information they wanted and simply left.
You can also implement Google Tag Manager’s scroll tracking function to track engagement metrics, allowing you to analyze how well the landing page matches the visitor’s search intent.
To set up Google Tag Manager:
- Log in as described in the steps above at tagmanager.google.com.
- Install the container in your website or app.
- When it comes to web and AMP pages you can add the container snippet according to Tag Manager’s instructions.
- For mobile apps, you can use the Firebase SDK for both Android and iOS.
- Now you can add and publish your tags.
Google Ads
You can use Google Ads to get actionable data and improve organic rankings and even benefit analytical SEO. By experimenting with ad copies, you can quickly test copy changes before testing organic search. All elements of search ads (copy, keywords, etc.) can be used to optimize content, focus keywords, and meta text of any webpage.
In addition, since paid search results show up quickly, even for competitive terms, you can use the data gained from ad campaigns to rank for them organically in the long term.
To set up Google Ads:
- Log in to the existing Google Ads account or create a new one at ads.google.com.
- Click Campaigns on the left-side menu.
- Click the plus button and select New campaign.
- Select campaign goals or select Create a campaign without a goal’s guidance if none of the offered goals fit.
- Select a campaign type (Search, Display, Video, Shopping, Discovery, App, Local, Smart).
Google My Business
This tool is a must for local businesses. Local searches tend to be bottom-funnel, and users frequently don’t even reach the website — all actions are taken directly on Google. That’s why it’s vital to get all the available data on GMB conversion actions.
- Sign into your Google account at google.com/business.
- Add your business. If the business doesn’t appear in the drop-down menu, you can type it in and click Add your business to Google. Don’t forget to select the appropriate category for it.
- Enter your location and select whether the business has a location customers can visit.
- Fill in contact information.
- Verify your business
Databox
Finally, Databox itself is an excellent tool you can use to visualize the data and present it in an easy-to-understand way. Dashboards are customizable, and the platform supports a large variety of integrations, allowing you to build a visualization for practically any purpose.
Connecting it is very simple. All you have to do is sign up for an account and connect your data sources.
To connect the data source:
- Navigate to the Data Manager page and click on the green + New Connection button.
- Search for the Data Source that you want to connect
- Hover over the data source and click the green Connect button to start the process.
After that, Databox will prompt you to enter your login credentials in the popup window, and you’ll have to follow the Data Source-specific steps to complete the connection process.
If you run into any trouble, you can contact Databox’s customer success team that will be more than happy to help you when it comes to creating your very own dashboard.
SEO Analysis via Data Visualization
While Google provides excellent SEO analytics tools, its client reporting solutions have a lot of room for improvement. If you want to build a report in the Google Suite, you have to combine the Search Console, Google Analytics, and Data Studio. This can be a time-consuming process because all the time spent processing and collating data with these tools can quickly get out of hand.
However, most clients aren’t as concerned with the technical details of SEO as marketers and SEO specialists are. They usually want a simple report they can understand. The report needs to cover the performance summary and recommendations based on the analysis of the data.
Databox’s pre-built SEO templates can simplify the whole reporting process. All you have to do is connect your Google Analytics account, and you’ll be able to build your own customized dashboard with all the necessary data.
Decision Making and Acting on Insights
All the information in the world won’t do you any good unless you actually act on it. However, a lot of people overlook this step or just don’t dedicate enough attention to it. You need to make it a priority. Take a look at the data and turn a report into a full-blown analysis. Ideally, you should interpret the data, explain it, recommend the course of action based on said data, and justify and prioritize your recommendation.
When the client has read the report or seen the presentation, they should know exactly what the situation is and what are the next steps towards achieving their goals. Frequent meetings with clients and/or scheduled reporting can help solidify the plan and ensure everyone is on the same page when it comes to decision-making. Follow up the meetings with clients with internal planning sessions where you’ll assign tasks and organize the workflow. Using your standard project management tools like Trello, Basecamp, Asana, or Jira should make the process significantly easier.
Finally, we come to the execution. Execution is significantly more expensive and time-consuming than analytics, but it’s also necessary. Based on insights and plans from previous steps, you need to develop new content, overhaul existing content, build backlinks, perform on-site technical optimization, and work on your local SEO.
SEO Analytics Best Practices: 5 Ways to Use SEO Analytics Reports to Boost Your Rankings
Next, we’ll show you which metrics are important when it comes to improving the search engine rankings of your clients’ websites. You’ll also see some tips that will cover how to use reporting to drive more traffic.
- Analyze Average Time on Page to Improve Content
- Identify Optimization Opportunities with Google Search Console
- Check If Your Website is Mobile Friendly
- Monitor Your Website’s Speed
- Use Internal Site Search to Your Advantage
Analyze Average Time on Page to Improve Content
Most people focus on the bounce rate (a great metric, to be sure), but Average Session Duration and time spent on individual web pages can be even more useful.
By looking at how much time users spend on any individual page you can identify why visitors spend little time on it.
Some of the common reasons people don’t spend much time on a given page include:
- Poor visual presentation — the content may not be scannable or presented clearly enough. Some good ideas are to use headings, short paragraphs, lists, and provide a table of contents to ensure visitors can find what they’re looking for easily.
- Wrongsearch intent — sometimes a user will come across a page with the information they weren’t looking for. After giving it a brief look, they’ll probably leave. To identify what you’re doing wrong, look at other Google results on the same subject and try to figure out what you’re doing wrong.
- Wrong keyword targeting — very similar to search intent, users might just stumble on your content looking for something completely different. Performing keyword research and modifying the content accordingly can take care of that, but ensuring you have the relevant keywords in place before even starting to write content is even more important and saves a lot of time in the long run.
- The page is doing exactly what it’s supposed to — this is the best-case scenario and means that the page is directing users to where they need to be, whether it’s a page with more information or a conversion page. If this is the case, your page is doing great, and you probably don’t need to change anything.
Identify Optimization Opportunities with Google Search Console
Next, we’ll focus on the Queries report in the Search Console. It can show you keywords that are leading people to your website and help you identify opportunities for search terms you could work on to improve your ranking.
You want to look for terms that have high impressions but low clicks, have a low CTR, and are close to ranking on the first page of search results.
the best way to improve the position and CTR of the page is to review other sites that are ranking for the same keyword and improve the page based on your findings. You can also modify titles and meta descriptions of pages to draw users in and interlink the content on your site to ensure the users have easy access to anything they’re looking for.
Check If Your Website is Mobile Friendly
Usability on mobile devices is an increasingly important SEO ranking factor. You can use Google Analytics to find out how your client’s website is doing with mobile users. Check the percentage of mobile visitors, how long they spent on the website, how many pages they visited, bounce rate, and other metrics, and then compare them to desktop traffic.
While it’s natural for the number of mobile users to be lower, it shouldn’t be dramatically lower. Compare the relevant metrics and try to figure out if they’re having trouble navigating the site or if they’re leaving because of long load times.
Since a high mobile bounce rate can significantly lower your SEO rankings, you should try to deal with these issues as soon as possible.
Monitor Your Website’s Speed
Another ranking factor that’s becoming more and more important is site speed. Website speed has been added to Core Web Vitals in 2021, making it incredibly important. Google is very keen on user experience, and since slow websites lead to a poor user experience, increasing your client’s site’s loading time and navigation speed can give it a much-needed SEP boost.
Ensure you monitor the speed in your reporting tool and try to lower it whenever possible.
Use Internal Site Search to Your Advantage
Internal search can be an invaluable tool to keep track of visitor behavior. Once you know what they’re looking for, you can give it to them and thus boost the site’s SEO, increase organic reach, and draw more traffic. All of those things combined will lead to a higher number of conversions.
By monitoring what visitors are typing into the site’s search console, you can discover if there are search terms that you don’t have content for yet and modify your editorial plans accordingly.
Simplify SEO Analytics Reporting with Databox
SEO Analytics reporting can be a daunting process. You often have to track multiple data sources and connect them to a variety of platforms, making the collation of available information a time-consuming challenge. This time and effort could be directed elsewhere, and with Databox, you have the opportunity to do just that.
Databox can help you simplify the process of client reporting, allowing you to build comprehensive, easy-to-read visual SEO reports. You can connect any number of data sources and use the resulting information to customize the dashboards to focus on relevant metrics.
SEO analytics reporting has never been easier. See it for yourself by signing up for a free trial now.

About the author
Davor Štefanović Davor is an English literature graduate and an avid reader with a passion for languages. Working as a translator, editor, and writer has allowed him to learn about a wide range of topics — making him something of a jack-of-all-trades when it comes to content. In his spare time, he reads, plays video games and boardgames, and runs/plays tabletop RPGs.
Get practical strategies that drive consistent growth
SEO Analytics: A Comprehensive Step-by-Step Guide
This guide will introduce you to SEO analytics and help you become more familiar with optimization efforts. You’ll discover that SEO analytics is more than simply data; it’s data and ecosystem. Consider data to be words, and the ecosystem a combining material that helps to make sense of those words. Learn how to interpret SEO statistics and how to make your marketing efforts more effective.

Feb 11 2020 ● 15 min read

Table of Contents
What is SEO Analytics?
SEO analytics is defined as a method of collecting and analyzing your data to gain a better understanding of your website’s organic performance. An effective SEO analysis helps identifying key areas to focus on when optimizing your site for search engines. To master SEO analytics and report on SEO data, use tools like Google Analytics or Google Search Console.
5 Types of SEO Analysis
SEO content audit
A standard definition of an SEO content audit — the process of evaluating current content on your website in order to determine how you can get more high-quality traffic to each page. An SEO content audit also helps to identify areas for improvement to increase conversions.
Auditing content will provide you with information on which blogs/e-shops and pages:
- Are seeing a drop in search traffic. This could be due to seasonality, technical issues or algorithm changes;
- Are affecting your overall website performance in a negative way;
- Are providing value to SERPs and website visitors alike.
Site audit
A site audit is one of the most comprehensive reports evaluating the overall performance of a website. It combines all the pages’ to provide an overall SEO health score.
Improve your site’s performance by implementing an SEO audit into your SEO strategy and benefit from:
- Identifying any issues that may exist on-site or off-site;
- Enhanced keyword distribution;
- Detailed competitor analysis to discover successful strategies.
Off-page SEO
Off-page SEO, also known as off-site SEO, refers to actions taken outside of your website to impact the rankings within SERPs.
This is where you’d analyze:
- Distribution of anchor text;
- Quality of link sources;
- Number of backlinks to certain pages;
- Referral traffic from backlinks.
To have a strong backlink profile, there are even more things that an SEO specialist should consider:
- Incorporating a large number of organic, relevant, and high-authority backlinks;
- Natural anchor text selection;
- Keep the number of low-quality links as low as possible. Disavow spam links using Google Search Console.
In other words, backlink profile analysis shows the aggregate quality of backlinks your website has managed to acquire over time. Tools like Ahrefs and SEMrush have their own proprietary way of measuring the overall backlink quality of pages using Domain Rating and Domain Authority.
On-page SEO
On-page SEO, also known as on-site SEO, is the application of SEO best practices to the content you create in the hopes of improving its ranking in search results. On-page SEO analyzes:
- Headings;
- CTR of queries;
- Title tags;
- Content;
- Internal link structure.
But the list doesn’t stop here. As described in this on-page optimization checklist from GOTCHSEO, other factors can influence your ranking in Google, so make sure you identify the ones relevant to your site.
On-page SEO tools data analysis benefits specialists by providing data that identifies areas for improvement. This data can then be used to try:
- Optimize content with newly acquired data;
- To expand reach by capturing more relevant keywords.
It can also provide data on the audience of your website, particularly location data, that can help with decision-making on how to expand the site. If your analytics determine a potential audience in a region that speaks a certain language, it might be worth investing in SEO translation to create well-optimized multilingual content.
Technical SEO
Technical SEO is a method in which the goal is to ensure that the site meets the technical benchmarks of current search engine standards. Furthermore, technical SEO analysis aids in the improvement of organic rankings. Here are some of those benchmarks:
- Page loading time. You hurt your ranking by not optimizing website speed. Google prefers web pages that load quickly, as this characteristic indicates a better user experience;
- Dead links. The more non-existent landing pages and broken links there are, the worse the user experience becomes. SEMRush, a SaaS platform for SEO optimization, includes a ‘Broken Link Checker’ feature that can help you find broken links on your website;
- Duplicate content. The presence of duplicate content confuses search engines. They are unsure which content is better and should be ranked higher. This minor error has the potential to harm both content pieces and lower their rankings;
- Website security. Technical SEO audits also ensure that your website is secure. Privacy is a minimum necessity for search engine users, and you must focus on ensuring that it is met. Implementing HTTPS would be one solution. They guarantee that no one can hijack data transmitted between the browser and the site. A secure website is ensured with a targeted VPS hosting provider for a certain location, such as VPS Europe.
This is critical because, once again, search engines like Google recognize the importance of security and, as a result, rank websites with HTTPS higher.
How Do You Analyze SEO Data?
To conduct a perfect and thorough SEO data analysis, follow these 7 crucial measures.
Check your page speed
«Two seconds is the threshold for eCommerce website acceptability. At Google, we aim for under a half-second». According to research, even a one-second improvement can increase online revenue by 7%. Not only that but the negative side of slow loading time could be increased bounce rate and decreased satisfaction with your UX and UI.
As you want your visitors to enjoy ‘their stay’ on your website, you should check your page speed with, for example, Google PageSpeed Insights. After doing that, try to fix the areas that slow your website down. Usually, the advice is to:
— Enable caching.
This means that a visitor’s browser downloads your website’s resources (e.g. JavaScript files or images). Doing that is critical to speeding up return visits;
— Minimize HTTP requests.
If you get more than 50 HTTP requests, you need to focus on reducing this number. Deleting unnecessary images and reducing image size would be the very first things to do.
— Choose, if needed change, the hosting option.
Consider web hosting services that you are currently using. Maybe there is a business offering a better-optimized web with faster load speed.
— Compress files.
Compressing files reduces data transmission time. Use youcompress and compress images, videos, and any doc.
Interesting insight: 3rd party code like GTM and Hotjar could potentially slow down the performance of your website. This is due to the extensive list of tags that marketers use on their websites to track and assess user behavior. Make sure you use tags only on the most necessary pages, pause tags that aren’t in use, and remove the ones that delay the scroll.
Check your visibility on Google
SEO visibility on Google is defined by Searchmetrics as a measure of how visible a site is in organic search results when queries are entered into search engines on desktop computers.
This visibility gives an insight into:
- How well you are targeting specific keywords;
- How easy it is for Google to crawl your pages;
- How compelling are your titles;
- How well you optimized your website.
Here is a website where you can check your visibility. It will inform you of your website’s visibility on mobile and desktop devices. Alternatively, you can get valuable and actionable search visibility insights for the specific region and time period by performing a Google Ranking Check with SE Ranking.
Audit your images
Image optimization influences the way search engines calculate your site rank. To make sure your SEO efforts are successful, back them up by:
- Go through image descriptions and update or include alt texts and image file names;
- Compress image files;
- Optimize your images and files so they are mobile-friendly. In 2018, over 50% of worldwide web traffic was generated through mobile phones.
Nick, the CEO of DataforSEO, discusses his thoughts on large media files:
«One thing I noticed on a lot of websites are huge media files that slow it down significantly. Businesses want to show high-resolution images which is perfectly fine. However, if those aren’t optimized for SEO, they can create huge issues. Some websites even crash because of the inappropriate size. Videos fall in this category as well. They make it almost impossible to scroll on the website if they take too long to load«.
Check your URLs
To analyze your URL, Google has provided a free inspection tool that includes information such as:
- AMP (accelerated mobile pages) errors;
- Structured data errors;
- Indexing issues.
Analyze Your Website Content
Auditing website content provides a chance to rank higher than before. You want to stay relevant and up-to-date with your content if one of the goals is to be more visible and increase CTR.
Here are 4 frequently used steps in a website content analysis:
- Page title. Usually, it is recommended to keep the title at 50-60 characters, have the word HOW, WHAT, or WHY, and have the main keyword you are trying to rank for;
- Target keyword.
Mike Lowe, Founder & CEO of Growthsaloon.com shared his insights about keywords:
» Many SEOs go back and forth on this one. But I’ve found it’s better to try to rank high for 1 keyword rather than try to rank decently for multiple keywords. If you match your H1 and your Page Title, Google can better understand what your page is about. My motto is that it’s better to rank Top 10, Top 3, or #1 Overall for 1 keyword — instead of ranking on Page 2 and beyond for multiple keywords«.
3. Meta description. Make sure your description is within the character limit and has a keyword. Here is a SERP Snippet Optimization Tool that allows you to write meta descriptions and titles that fit the word limit;
4. Secondary keywords. These are usually similar to the primary keywords, yet they play a supporting role. Add secondary keywords by addressing the nuances and subtopics about the related primary keywords that the user is interested in. This will demonstrate to Google that you’re a professional who understands things and user intent.

Evaluate Backlinks
Look at the backlinks your content pieces have. See if any of them are spammy and compare the backlink numbers with your competitors. Here is a tool to do that serpstat. You ideally want to have as many high authority backlinks as possible. That means links from high-quality websites that have good SEO performance, and are relevant to your niche.
As an expert SEO puts it:
I like to look at a couple of things when assessing a potential backlink. First, the usual—organic traffic and Domain Rating. I tend to aim at domains with rising traffic of at least 5,000 and a DR of at least 40. Next, I take a quick look at the cache date on the desired article. It tells me whether that particular piece has been recently crawled, which is a signal that Google likes that URL. If you can easily buy a link on said domain, it’s a no-go for me. Websites that don’t have any specific topical range are also weak in my mind. Finally, using the site: command on Google, I check whether the site has any risky content such as casinos or essay writing.
Milosz Krasiński, International SEO Consultant, Speaker, and Blogger.
Check Your Internal Links
Internal links refer to the links that go from one page to another within the same domain. In other words, it’s when you put one blog’s link on another blog. To add, internal links build a site structure to help Google better assess what the content is about and how your whole website relates to various topics. Investigating internal links will provide a smoother user experience for visitors.
Consider a user who visits your blog and clicks on one of the links only to discover that the link is broken or that the material is no longer available. You should go over your links and eliminate any that don’t serve a function if you want to reduce these flaws and give your site a more professional appearance and improve user experience.
SEO Metrics
SEO metrics are data sets or signs that should be tracked and monitored to maintain a high-performing and optimized website. This is one of the most extensive and detailed SEO metrics lists you’ll find online:
- Leads: SEO leads are potential clients that find your website, services, or products through search engine results;
- Organic Traffic: Visitors that land on your landing page or website from unpaid sources are generating organic traffic. Two important indicators to include in SEO analytics are organic traffic source and total organic traffic.
If you connect your Google Analytics account with Whatagraph, you’ll find your organic search traffic metrics in one comprehensive report or dashboard;
- Referral Traffic: Refers to the traffic, when visitors come from outside sources or other websites;
- Keyword Rankings: The position of your page on the search results page for a specific search query is referred to as keyword rankings in SEO. Tracking this metric will provide actionable insights into how your keyword and website with that keyword is performing in Google;
- Bounce Rate: In web traffic analysis and in SEO, the bounce rate is a metric represented in percentages, showing visitors who visit one page before leaving;
- Pages Per Session: Curious about how many pages a person views in a single session? Pages per session will give you this percentage. The higher the percentage, the calmer you can be as it indicates that your content is interesting and your UX is smooth;
- Page Views: This metric indicates the total number of pages viewed. Google Analytics counts repeated views of a single page by the same viewer;
- Average Time On a Page: This measure calculates the average amount of time spent on a single page by all website visitors. According to several marketers, their average time on page is between 2-3 minutes. Others use «read time», which is calculated by averaging the number of words in an article and the words per minute speed of a typical reader;
- Top Pages By Page Views: If you want to find your top landing pages or blog posts, track top pages by page views. Google Analytics and Whatagraph is the go-to combination to easily learn about this metric. Connect your Google Analytics account to Whatagraph, and you’ll automatically be presented with a comprehensive, visually appealing, and easy-to-understand report (or dashboard);
- Conversions: Marketing teams define SEO conversions as a fulfilled desired action by website visitors. Those actions could include downloading a guide, filling in the form, or signing up to an email list. The average decent SEO conversion rate for B2B SaaS companies is considered to be 1.1%;
- Average Page Load Time: You should be tracking this number just to make sure that your mobile and desktop average page load times are not too long. As already mentioned, the ideal load time should be no more than 2 seconds;
- Organic Clickthrough Rate (CTR): CTR tracks the number of people who click on a search engine result. Organic click-through rate is mostly determined by ranking position, but it is also influenced by a result’s title tag, description, and URL. The primary purpose of CTR tracking is to gauge engagement and gain a better understanding of your customers. This measure reveals which material your audience finds fascinating, which pages they find uninteresting, and even which pain points they have.
- On-page Optimization Scores: On-site SEO score tells you how well the user-facing and technical aspects of your site contribute to search engine optimization, organic traffic, and higher rankings. You can use seositecheckup.com to find your general SEO health score and improve it by following their advice;
- Impressions: Google defines impressions as the number of times a URL from your site was displayed in a user’s search results, excluding paid Google Ads search impressions;
- Traffic cost: The traffic cost is an estimate of how much bidding on organic keywords through Google Ads will cost.
Setting Up Tools
Now let’s talk about the tools you could use to perfect your SEO analyses.
Whatagraph
Whatagraph is a tool that allows marketers to track campaign results across several platforms. Build detailed SEO reports and let data insights lead the way. Using our automated SEO reporting tool, you can assess the effectiveness of your search engine optimization efforts. Whatagraph connects with Google Analytics, Google Search Console, SEMrush, and Ahrefs, among other SEO tools. Our SEO reporting software allows you to track any of the already mentioned metrics and visually present them so that you can immediately learn about your website performance.
Whatagraph’s features assist marketers to spot patterns in how visitors interact with their website. Those features include:
- Data analysis, monitoring, reporting, collection, and visualization;
- Data visualization with scorecards and motion charts that display changes in data over time;
- Cross-channel reporting to help you analyze data and compare different channel performance in one place;
- Funnel analysis;
- Data collection APIs;
- Custom reports for advertising, acquisition, audience behavior, and conversion;
- Email-based sharing;
- Interactive dashboards and reports.
Google Analytics
Google Analytics is a web analytics platform that offers basic analytical tools and statistics for search engine optimization (SEO). They use page tags to collect user data from each viewer.
A JavaScript page tag is inserted into the Google Analytics tracking code of each page. This tag collects data from each visitor’s web browser and sends it to one of Google’s data collection servers. Google Analytics then generates customizable reports to track and visualize data such as:
- The number of users;
- Bounce rates;
- Average session durations;
- Sessions by channel;
- Pageviews;
- Conversion rates.
Google Search Console
Google Search Console (formerly known as Google Webmaster Tools) is a free service that allows you to manage and troubleshoot the appearance of your website in search results. It can be used to detect and resolve technical faults, submit sitemaps, and view backlinks.
Bing Webmaster Tools
Bing’s Webmaster Tools is a useful tool that allows website owners to keep track of their site’s status in Bing’s search results. It provides search data like:
- Site traffic;
- Rankings;
- Indexing.
Ahrefs
Ahrefs is an SEO software suite that contains tools for link building, keyword research, competitor analysis, rank tracking, and site audits. With Ahrefs acc:
- Identify Keywords;
- Audit your site;
- Check Website’s Content;
- Track your ranking;
- Check Backlinks of Competitors;
- Identify Broken Links.
Ahrefs features the largest backlink index of any tool on the market. You may use this tool to monitor your competitors’ SEO methods, backlinks, keywords, and other factors. If you’re on a budget though, there are some alternatives to Ahrefs which perform a similar function at a lower price.
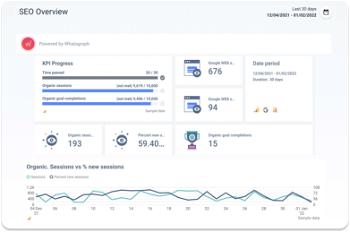
SEO Analytics Reports & Dashboards
Whatagraph provides a variety of template and widget options to assist you in quickly creating a custom SEO dashboard or report. They’ll be as detailed or as brief as you want them to be; either way, they’ll be equally visually appealing and easy-to-understand.
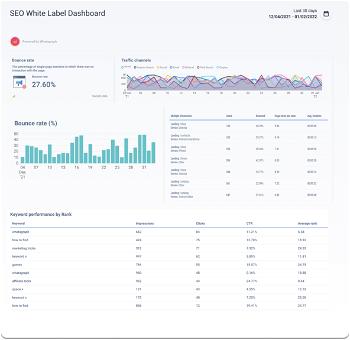
One of the most popular SEO dashboards is the SEO White Label Dashboard. Specialists would create this dashboard to view: keyword rankings, top-performing pages, CTR, and other metrics to demonstrate the success of your SEO efforts.
SEO White Label Dashboard assesses:
- Top landing pages;
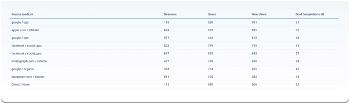
- Traffic sources;
- Bounce rate;
- CTR;
- Organic keywords.
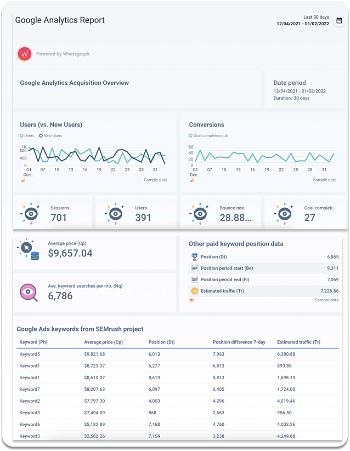
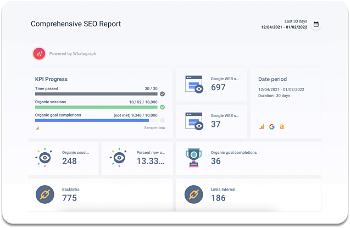
If there was a need to compare website SEO results to the objectives, a Google Analytics SEO report would come in handy. Whatagraph can be connected to a Google Analytics account to allow for simple tracking of KPI progress. One of Whatagraph’s features, ‘goal widgets’, lets specialists easily track the success of their SEO objectives. They can even set a timeframe for achieving those goals.
Sometimes SEO specialists need access to a bit more information. Whether it is to find data patterns or understand current tendencies. A comprehensive SEO reporting dashboard connects to the most popular platforms, such as Google Search Console, Google Analytics; or SEMrush, and provides access to all of the key SEO insights and metrics in one place.
Lastly, we have to mention Keyword Ranking Reports. You wouldn’t find a single SEO specialist that wouldn’t need one! Start tracking and filtering targeted keyword rankings to identify top keywords and make informed content creation decisions.
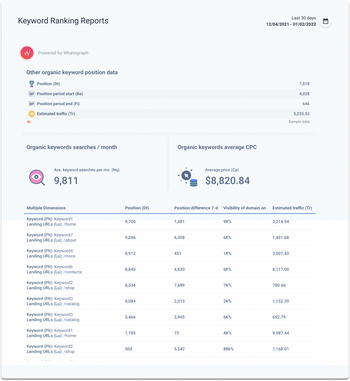
Whatagraph’s Keyword Ranking Reports automatically pull up-to-date insights and can even schedule them to be sent out at your convenience — daily, weekly, monthly, or even quarterly. Create and distribute comprehensive performance reports in a fraction of the time.
Bottom line
One of the most advantageous aspects of running an SEO campaign is that you will generate a large amount of data to work with in the future. This data will enable you to make data-driven decisions and develop better strategies.
To take advantage of this data and create successful SEO roadmaps you need an analytics tool. Sign up for a free 7-day trial of Whatagraph and start generating SEO reports that are most valuable to you.
Published on Feb 11 2020
Источник https://databox.com/seo-analytics-reporting
Источник https://whatagraph.com/blog/articles/seo-analytics